 |


Bandwidth: 1 GHz
Sampling rate: 5 GSa/s
Channels: 4
Advanced Waveform DSP/Math
7 inch colour display
Time base system
Time base: Main and delayed
Time/div Range: 200 ps/div to 10 s/div
Vertical system
Vertical resolution: 8 bits (<11 bits with averaging)
Vertical sensitivity: 1 mV/div to 10 V/div
Maximum input voltage: ± 400 V
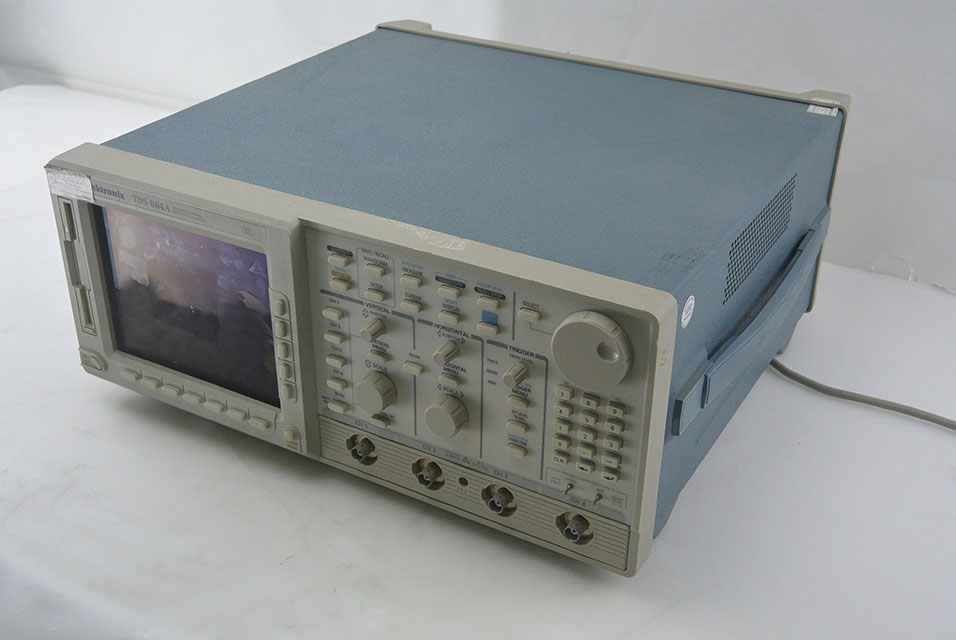
Tektronix TDS684A Oscilloscope, Digital: 1GHz,5GSa/s,4ch (Stand alone)The Tektronix TDS684A oscilloscope is a graph-displaying device; it draws a graph of an electrical signal. In most applications, the graph shows how signals change over time: the vertical (Y) axis represents voltage and the horizontal (X) axis represents time. The intensity or brightness of the display is sometimes called the Z axis.The Tektronix TDS684A oscilloscope's simple graph can tell you many things about a signal, such as: the time and voltage values of a signal, the frequency of an oscillating signal, the moving parts of a circuit represented by the signal, the frequency with which a particular portion of the signal is occurring relative to, other portions, whether or not a malfunctioning component is distorting the signal, how much of a signal is direct current (DC) or alternating current (AC) and how much of the signal is noise and whether the noise is changing with time. Auto Scale Advanced Math Floppy Drive
Bandwidth: 1 GHz
Sampling rate: 5 GSa/s
Channels: 4
Advanced Waveform DSP/Math
7 inch colour display
Time base system
Time base: Main and delayed
Time/div Range: 200 ps/div to 10 s/div
Vertical system
Vertical resolution: 8 bits (<11 bits with averaging)
Vertical sensitivity: 1 mV/div to 10 V/div
Maximum input voltage: ± 400 V
Tektronix TDS684A Oscilloscope, Digital: 1GHz,5GSa/s,4ch (Stand alone)The Tektronix TDS684A oscilloscope is a graph-displaying device; it draws a graph of an electrical signal. In most applications, the graph shows how signals change over time: the vertical (Y) axis represents voltage and the horizontal (X) axis represents time. The intensity or brightness of the display is sometimes called the Z axis.The Tektronix TDS684A oscilloscope's simple graph can tell you many things about a signal, such as: the time and voltage values of a signal, the frequency of an oscillating signal, the moving parts of a circuit represented by the signal, the frequency with which a particular portion of the signal is occurring relative to, other portions, whether or not a malfunctioning component is distorting the signal, how much of a signal is direct current (DC) or alternating current (AC) and how much of the signal is noise and whether the noise is changing with time. Auto Scale Advanced Math Floppy Drive


